Just as you evaluate energy pathways, wind power provides abundant, low-carbon generation that strengthens grids, lowers operating costs, and spurs jobs and investment; by understanding turbine design, site assessment, transmission planning, and storage integration you can appreciate how wind scales from community projects to multinational fleets and informs your planning to reliably expand sustainable energy capacity around the globe.
Key Takeaways:
- Falling costs and rapid capacity growth make wind power a leading contributor to global clean-energy expansion and emissions reductions.
- Advances in grid integration, storage, and transmission enable reliable, higher shares of variable wind generation in energy systems.
- Wind energy creates jobs, local investment, and greater energy security when supported by coherent policy and infrastructure planning.
The Basics of Wind Power
You should note wind already supplies over 800 GW globally, with onshore farms providing the bulk while offshore capacity grows rapidly; on good coastal sites capacity factors often exceed 45%. Turbine sizes span from <100 kW distributed units to 8-15 MW offshore giants, and policy-driven auctions accounted for roughly 70% of recent additions in major markets like China, Europe, and the U.S., so your project economics will hinge on site wind class and grid access.
How Wind Turbines Work
You’ll see three core systems: rotor blades capture kinetic energy and spin a low-speed shaft, a gearbox (or direct-drive alternative) matches generator RPM, and the generator produces AC power that is converted and stepped up for the grid. Power scales with the cube of wind speed-so modest wind improvements dramatically raise output-and Betz’s limit caps theoretical extraction at 59.3%, making aerodynamic design and siting important for performance.
Types of Wind Energy Systems
You’ll encounter onshore utility farms (2-4 MW turbines), offshore farms using 8-15 MW machines, small distributed turbines under 100 kW for farms and microgrids, vertical-axis units for turbulent urban sites, and hybrid installations pairing wind with storage to firm output; you should select systems based on turbine class, expected capacity factor, and interconnection options.
- Onshore utility-scale farms: lowest LCOE in good wind regimes, project sizes often 50-500 MW.
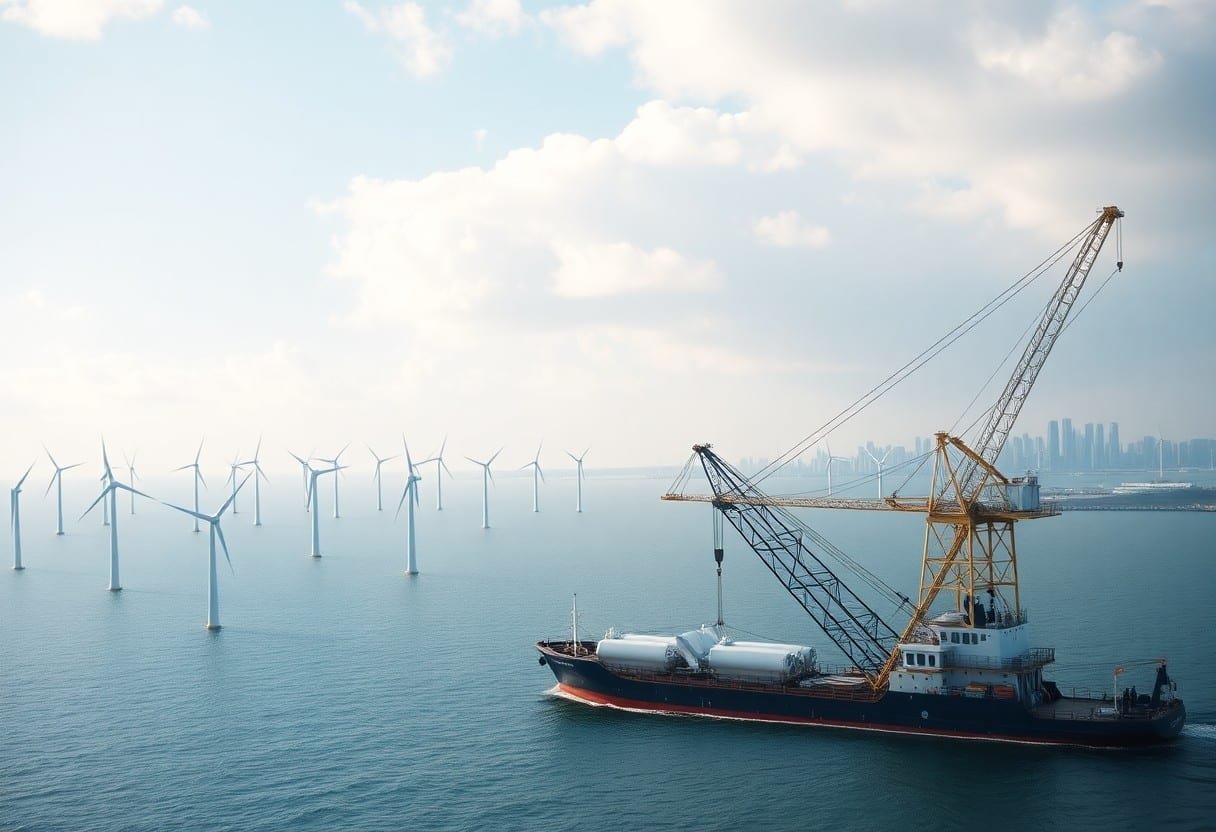
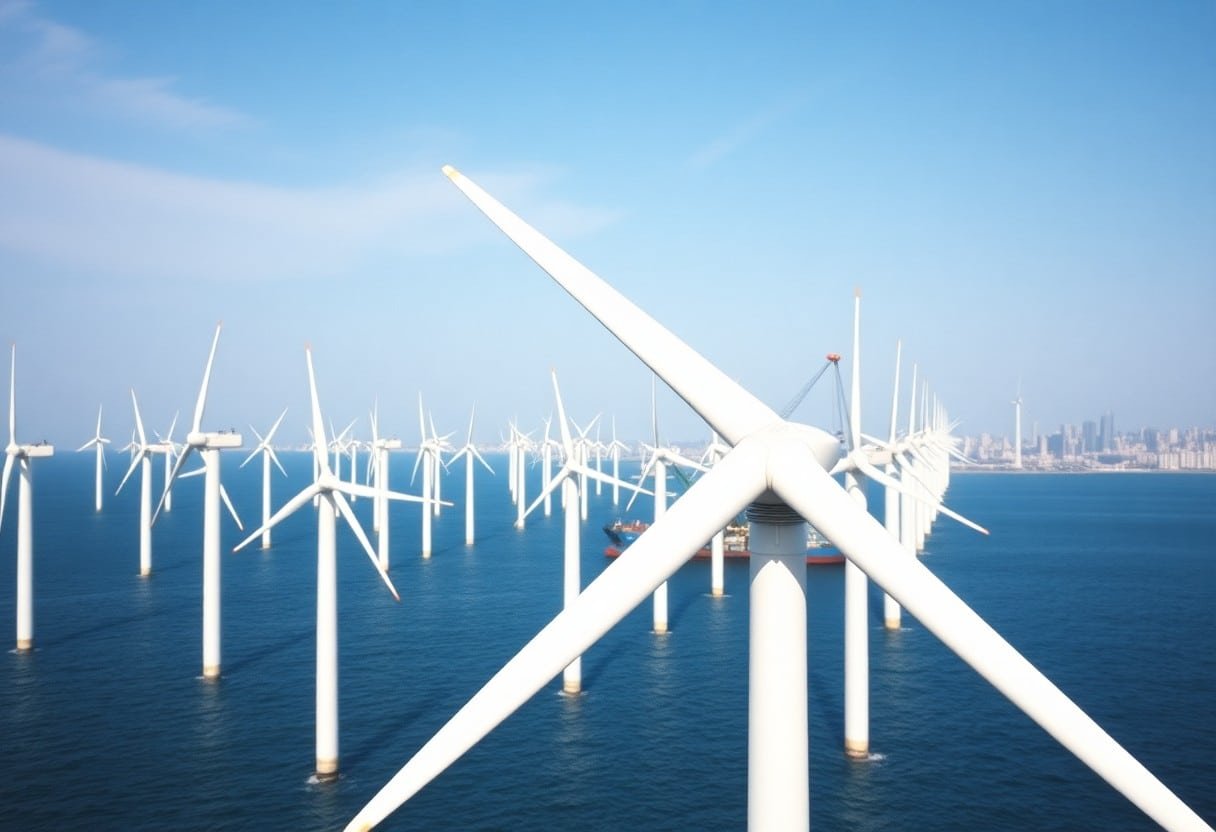
- Offshore farms: higher CAPEX but capacity factors 40-60% and rapidly falling costs with larger turbines.
- Distributed/small turbines: serve remote loads or distributed generation needs, typically <100 kW.
- Any hybrid systems pairing wind with battery storage (e.g., Hornsdale-linked wind sites or pilot floating-wind-plus-storage projects) improve dispatchability and grid services.
| Onshore utility | Typical turbine 2-4 MW; project 50-500 MW |
| Offshore utility | Turbines 8-15 MW; higher CAPEX, CF 40-60% |
| Distributed/small | Under 100 kW; off-grid or community scale |
| Vertical-axis | 5-500 kW; suited for complex urban flows, lower efficiency |
| Hybrid wind+storage | Pairs batteries or hydrogen for firming and ancillary services |
If you dig deeper into system selection, compare costs and examples: onshore LCOE in good sites often ranges $30-60/MWh, while offshore has been $60-120/MWh but declines with turbine scale. Denmark and the UK showcase fixed-bottom offshore, and Equinor’s Hywind Scotland demonstrated commercial floating viability; you should factor in siting wind class, grid reinforcement costs, and consenting timelines when sizing your project.
- Cost profile: onshore lowest in strong-wind inland sites; offshore costs drop as turbines scale above 10 MW.
- Turbine sizing: onshore 2-4 MW common; newest offshore models reach 14-15 MW.
- Siting factors: wind class, wake losses, distance to grid, and seabed conditions for offshore.
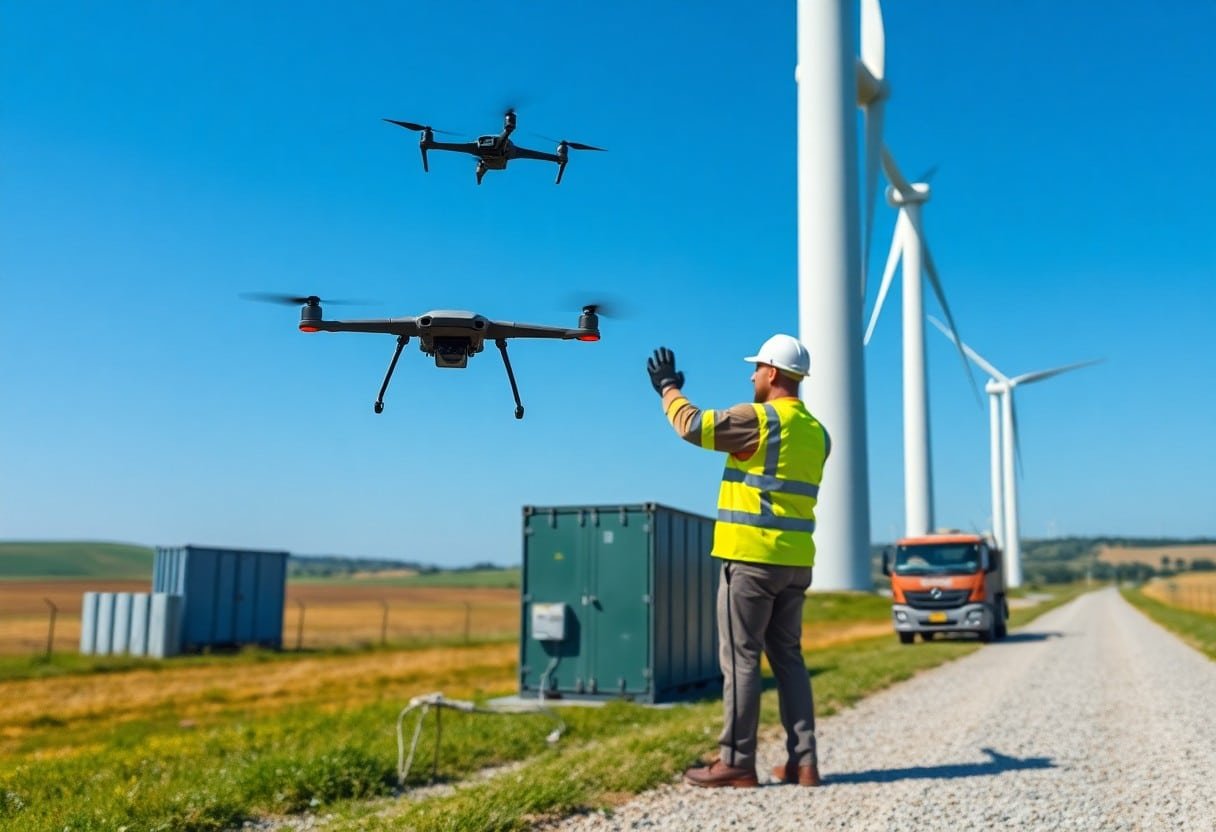
- Any long-term O&M strategy you adopt should include remote monitoring, blade-inspection drones, and condition-based maintenance to preserve availability.
| Metric | Typical range / note |
| Capacity factor | Onshore 25-45%; offshore 40-60% |
| Turbine size | Onshore 2-4 MW; offshore 8-15+ MW |
| LCOE (good site) | Onshore $30-60/MWh; offshore $60-120/MWh |
| Permitting & timeline | Onshore: months-2 years; offshore: 2-6+ years |
Global Wind Power Capacity
Global capacity now exceeds 900 GW, driven by both onshore fleets and rapidly expanding offshore arrays. You can see annual additions in recent years reaching tens of gigawatts, with record years surpassing 80-100 GW, while longer blades and higher hub heights boost capacity factors. China and the US account for large shares of cumulative capacity and new builds, forcing grid upgrades and new transmission planning that directly affect your project timelines and investment models.
Leading Countries in Wind Energy
China leads with around 400 GW, the United States about 150 GW, Germany roughly 60-65 GW, and India near 40-50 GW, while the UK and the Netherlands punch above their size in offshore capacity (the UK offshore fleet is around 13 GW). You can use these national examples to benchmark policy frameworks, manufacturing scale, and supply-chain practices when shaping your own deployments or investment decisions.
Regional Growth Trends
Asia has supplied the majority of recent capacity additions, driven by coastal and inland deployment in China and accelerating builds in India; you’ll notice Europe concentrating on offshore expansion and the Americas scaling large onshore projects. North America’s growth clusters-Texas alone exceeds 40 GW-contrast with emerging markets in Latin America and Africa that rely on auctions and targeted incentives. These regional patterns inform where you’ll find equipment cost competitiveness and grid-integration challenges.
For more detail, examine projects like the UK’s Dogger Bank (about 3.6 GW planned) and Hornsea (over 1 GW) as offshore megaproject case studies, alongside China’s coastal portfolios and Texas’ onshore hubs. You can observe Brazil’s northeast and South Africa maturing via auction rounds, and see how targeted grid upgrades in Europe and the US unlock higher capacity factors-insights you should factor into siting, contracting, and financing decisions.
Economic Benefits of Wind Power
Wind cut generation costs dramatically over the last decade-LCOE for onshore wind dropped roughly 40% since 2010-boosting investment and offering stable, low marginal-cost electricity to your grid. You can reference A comprehensive look into the sustainability of wind power for lifecycle and market analyses. Countries with strong wind sectors attract manufacturing, lower retail prices, and hedge against fossil-fuel price volatility.
Job Creation
You gain a broad employment base across manufacturing, installation, and operations: wind supports roughly 1.2 million jobs globally, with offshore projects creating high-skill maritime and engineering roles. In countries like Germany and Spain local supply chains produced thousands of factory and service positions; in the US, Texas’s wind boom sustained communities through turbine fabrication and maintenance. Policy certainty often translates directly into sustained hiring and apprenticeships.
Cost Competitiveness
You see onshore wind routinely compete with and undercut fossil generation; auction prices have fallen into the $20-$40/MWh range in many markets, and levelized costs have declined by roughly 40% since 2010. High capacity factors in windy regions plus zero fuel costs give you predictable supply and lower volatility compared with gas-fired plants, improving long-term planning for utilities and consumers.
You should factor in capacity factors-onshore typically 25-45%, offshore 40-55%-which raise effective value in windy sites, and levelized capital costs have fallen as turbine sizes rose to 6-12+ MW offshore. Market examples show PPAs locking in sub-$40/MWh rates for long terms, and when you combine wind with storage or diversified portfolios, system integration costs often remain below the savings from fuel displacement.
Environmental Impact
Wind cuts lifecycle emissions to roughly 10-12 g CO2e/kWh versus about 820 g for coal, so you can see how large-scale deployment rapidly lowers system carbon intensity. Turbine foundations and access use under 1% of site area, allowing continued farming or grazing on most projects. For deployment strategies and policy examples you can consult How to unlock wind power for a secure energy future.
Reducing Carbon Emissions
By displacing fossil generators you lower your grid’s carbon intensity: modern onshore turbines average 30-40% capacity factors and offshore 40-50%, so a 100 MW wind farm typically yields ~260-440 GWh/year, displacing hundreds of thousands of tonnes of CO2 compared with coal. Countries such as Denmark and regions in the U.S. Midwest show how rising wind penetration produces measurable emissions declines within years.
Land and Wildlife Considerations
You must address collisions, habitat loss and offshore noise when siting projects. Repowering and targeted mitigation at sites like California’s Altamont Pass cut raptor fatalities by roughly 80% through turbine replacement and curtailment, and strict setback rules preserve core habitats. Your permitting should mandate monitoring and adaptive management to limit local biodiversity impacts.
You can deploy practical measures: radar-triggered and AI-led smart curtailment has reduced bat and bird fatalities by ~40-60% with modest energy losses, while field trials painting one blade showed about a 70% drop in collisions. Offshore, bubble curtains can lower pile-driving noise by 10-20 dB to protect marine mammals, and continuous pre/post-construction monitoring lets you adapt operations based on observed impacts.
Technological Innovations
You can see rapid improvements in rotor size, hub height and digital controls that boost capacity factors; offshore machines now exceed 12-14 MW with 220+ m rotors, and predictive maintenance lowers downtime. For concise data and lifecycle metrics consult the Wind Energy Factsheet | Center for Sustainable Systems, which helps you compare performance and emissions across technologies.
Advances in Turbine Design
When you evaluate modern turbines, note GE’s Haliade‑X 12 MW and Siemens Gamesa 14 MW platforms with 220+ m rotors and 150m+ hub heights that capture steadier winds; carbon‑fiber blades and direct‑drive generators cut weight and maintenance, so your site can increase annual energy production by 20-40% versus older 2-3 MW units.
Energy Storage Solutions
You should pair wind with faster batteries and seasonal storage to firm output: lithium‑ion arrays deliver sub‑hour to multi‑hour response, pumped hydro provides over 160 GW globally for long duration, and Power‑to‑X (green hydrogen) enables multi‑week balancing for large wind fleets.
For example, Hornsdale Power Reserve in Australia demonstrated system value by providing 100 MW/129 MWh fast response to stabilize your grid; battery pack prices fell below $150/kWh by 2020, making utility‑scale deployments economical, while firms pursuing iron‑air and flow batteries target 10-100+ hour storage to match seasonal wind variability for your portfolio.
Challenges and Barriers
You face a mix of technical, economic and social hurdles: multiyear permitting and interconnection delays, supply-chain shocks after 2020 that extended lead times for blades and towers, grid constraints that force curtailment in high-wind regions, and financing risk when incentive frameworks shift. These obstacles slow deployment rates, raise levelized costs, and require coordinated policy and industry responses if you want wind to scale as projected.
Policy and Regulatory Issues
You confront fragmented regulations and unstable incentives that distort project timelines and bankability. For example, U.S. interconnection queues surpassed 1,000 GW, creating years-long backlogs; meanwhile shifting tax-credit rules and differing auction designs across Europe change revenue certainty. Streamlining permitting, harmonizing grid codes, and predictable revenue mechanisms directly lower your development risk and capital costs.
Public Perception and Acceptance
You often meet local resistance over visual impact, noise, and wildlife concerns. High-profile cases like Altamont Pass-where raptor mortality triggered repowering programs-show how ecological conflicts and weak early engagement can stall projects. Without clear community benefits or ownership options, opposition can translate into legal challenges and prolonged delays.
You can address acceptance with concrete measures: offer shared ownership or benefit funds, conduct early and transparent consultations, and use detailed environmental impact assessments. Operational fixes-raising turbine cut-in speeds during migration or curtailing at low wind speeds-reduce bat and bird impacts, while robust monitoring and adaptive management provide the data you need to demonstrate outcomes and maintain local support.
Final Words
Presently you witness wind power fueling sustainable energy growth worldwide by supplying scalable, low‑carbon electricity, stimulating innovation in grid integration and storage, and creating resilient local economies; by investing, supporting smart policy, and choosing clean power you expand capacity, cut emissions, and strengthen your energy security while helping decarbonize industry and reach global climate goals.