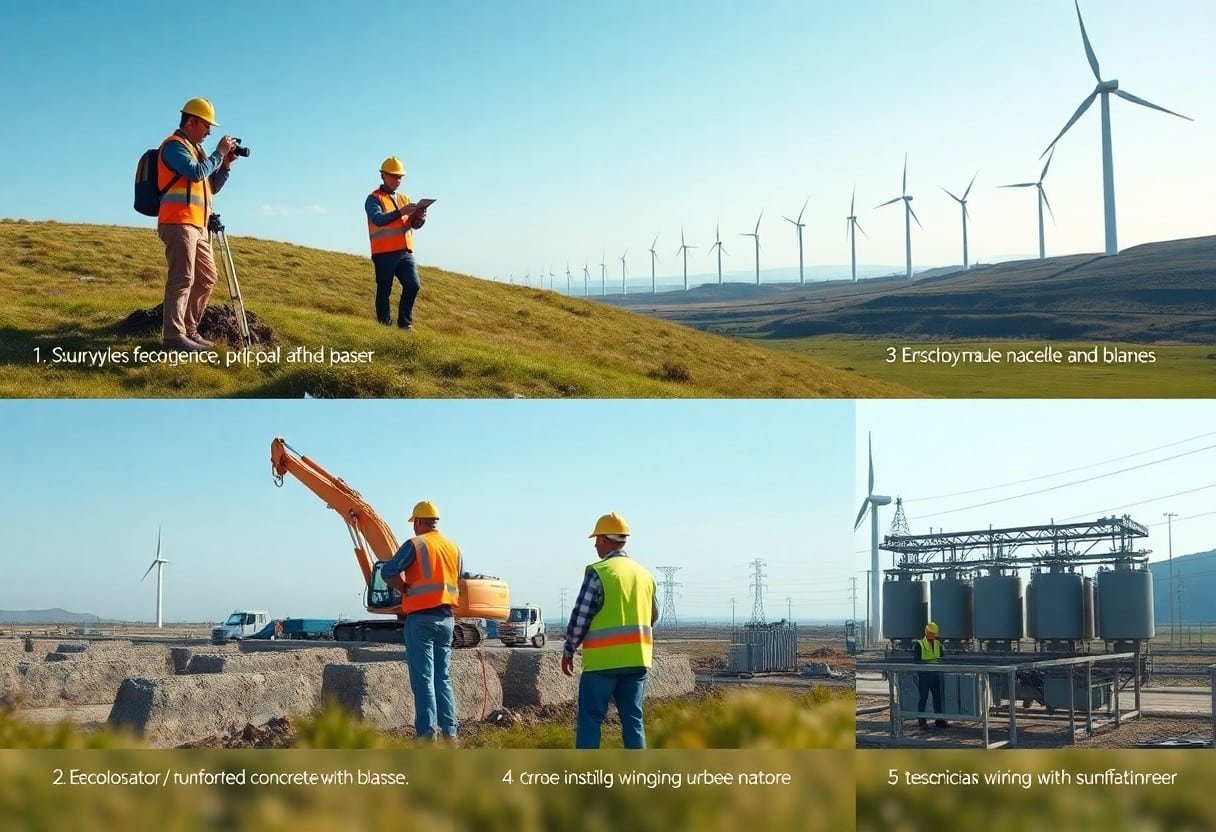
Infrastructure planning for wind projects requires a strategic roadmap that helps you assess site feasibility, secure permits and financing, engage stakeholders, implement resilient construction practices, and optimize long-term operations to ensure reliable, sustainable energy delivery.
Key Takeaways:
- Assess wind resources, grid access, environmental impacts and community concerns early to select optimal sites and streamline permitting.
- Secure stable financing, regulatory approvals and long‑term offtake agreements while building partnerships with local stakeholders.
- Choose reliable turbine and grid‑integration technology, plan construction logistics, and implement robust operations, maintenance and monitoring.
Overview of Wind Energy
You can deploy wind projects onshore and offshore, with global installed capacity now exceeding 830 GW; onshore turbines typically deliver 25-45% capacity factors while offshore reaches 40-60%. You’ll choose between fixed-bottom and floating foundations-Hornsea One (1.2 GW) exemplifies large-scale offshore deployment-and must analyze site wind resource, wake losses, and proximity to transmission to optimize annual energy output and returns.
Benefits of Wind Energy
You gain near-zero operational emissions-onshore wind lifecycle emissions are about 10-12 g CO2/kWh versus coal’s ~800 g/kWh-and low marginal costs once built. You’ll access competitive pricing in high-resource areas, secure long-term revenue through PPAs, and create local jobs in manufacturing, construction and O&M; large offshore projects commonly support thousands of construction jobs before moving to smaller operational teams.
Challenges in Implementation
You’ll face intermittency and grid-integration hurdles that drive needs for storage, flexible dispatch and transmission upgrades. You must manage permitting timelines (often 1-3 years onshore, 3-7 years offshore), community acceptance and wildlife impacts, while contending with supply-chain concentration-China supplies over 80% of refined rare-earth processing used in some turbine generator technologies.
You can reduce these risks through improved forecasting, grid-forming inverters and targeted transmission investments such as HVDC links for long-distance transfer. You should plan integrated storage solutions-batteries for short-duration smoothing, pumped hydro or hydrogen for seasonal balancing-and adopt mitigation measures like adaptive curtailment, radar-assisted shutdowns to protect bats and community-benefit agreements to accelerate permitting and social license.
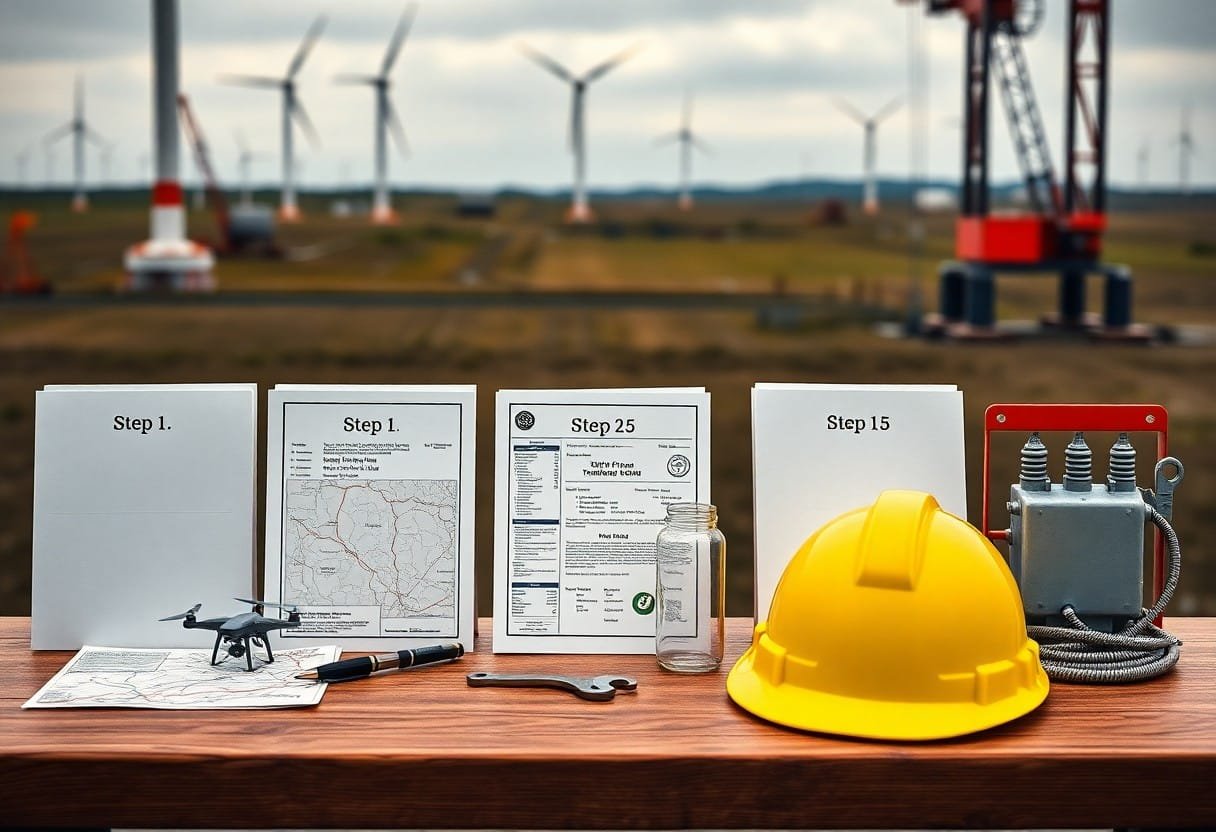
Step 1: Conducting Site Assessments
You combine wind measurements, environmental surveys, grid connection analysis, and permitting timelines to judge feasibility; deploy 1-3 year met mast or LIDAR campaigns at planned hub heights (80-140 m), run mesoscale models (e.g., WRF) for long-term correction, and map transmission proximity and land-use constraints to estimate development windows of roughly 12-36 months and preliminary energy yield for financial modeling.
Wind Resource Evaluation
You quantify the resource with 1-3 year measurements at hub height using met masts or LIDAR/SODAR, then apply WRF and micrositing tools like WindPro for wake and layout optimization; target mean wind speeds ≥7 m/s onshore, note turbines reach rated output around 12-14 m/s, and expect onshore capacity factors near 25-40% (offshore 40-50%) to size turbines and revenue forecasts.
Environmental Impact Studies
You perform baseline ecological and social surveys over at least 12 months-bird and bat counts, habitat mapping with GIS, noise and shadow-flicker modeling, and cultural-resource inventories-integrating seasonal migration radar where needed and documenting mitigation strategies for permit applications under NEPA/EIA or local frameworks.
Start with targeted methods: daytime and nocturnal transects, seasonal radar for migratory corridors, and ultrasonic detectors for bat activity. For offshore projects you add marine mammal acoustic surveys and pile-driving impact assessments. Implement mitigation such as turbine curtailment below ~6 m/s for bats, blade feathering, or micro-siting away from nesting sites; post-construction monitoring under adaptive-management plans-Altamont Pass repowering is a notable example where retrofit and removal reduced raptor fatalities and informed mitigation choices elsewhere.
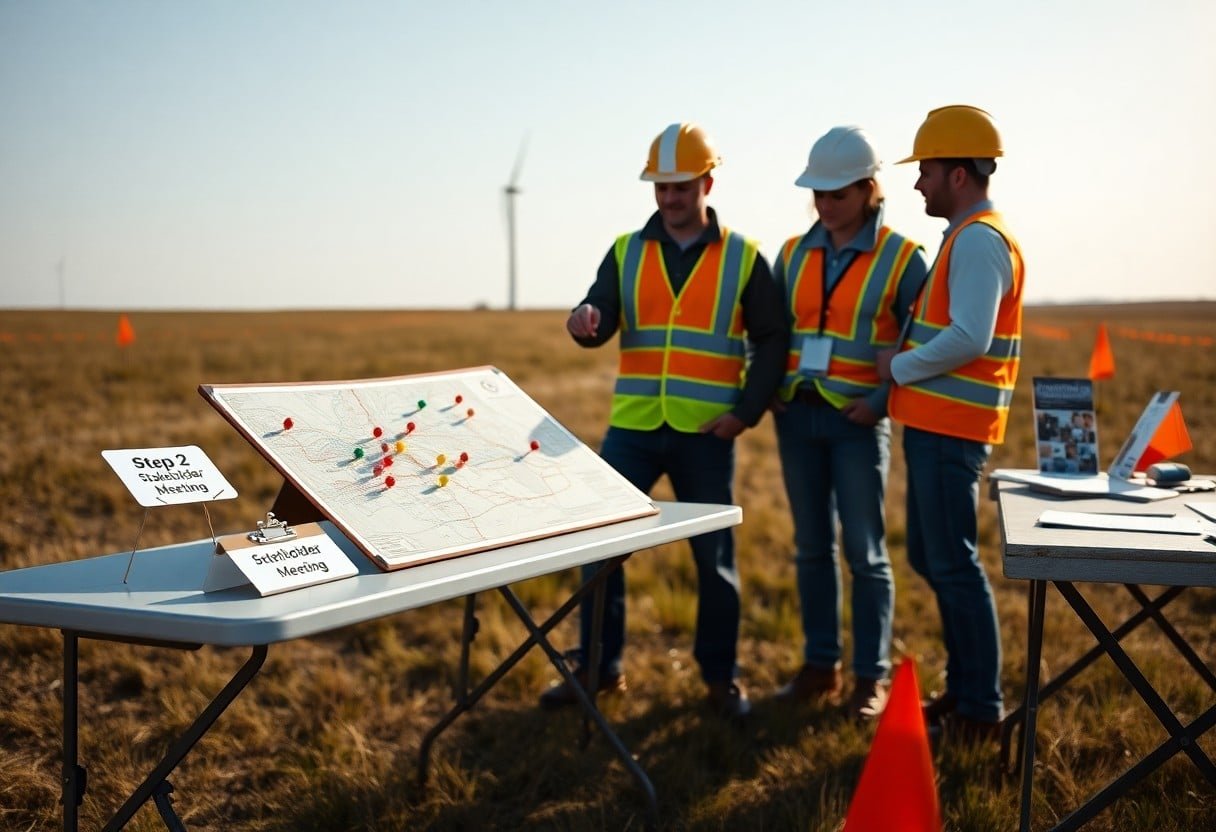
Step 2: Engaging Stakeholders
Map stakeholders early: landowners, grid operators, local councils, regulators, and NGOs all shape permitting and siting. Engage landowners with clear lease terms and grid operators about interconnection studies, since those studies and consultations can add 12-36 months to schedules. Use national and international policy guidance-see Five ways to jump-start the renewable energy transition now-to align your project with funding and permitting priorities.
Community Involvement
Start community engagement with transparent benefits: host 3-5 public meetings, publish visual simulations, and offer revenue-sharing or local hiring clauses. A 100 MW onshore wind project typically creates dozens of construction jobs and 5-15 long-term operations positions, so you can quantify local economic impact. Deploy early grievance mechanisms and community funds tied to measurable milestones to sustain trust throughout construction and operation.
Regulatory Compliance
You must map applicable laws-NEPA, EIA requirements, Endangered Species Act or EU Habitats rules, plus local zoning-and budget for them. Permit timelines commonly span 12-36 months, while interconnection queues may extend 2-5 years in congested regions. Engage experienced counsel, submit complete baseline studies, and schedule consultations to reduce iteration and delay.
For more detail, plan for at least one year of seasonal baseline surveys (avian, bat, habitat, noise) to meet EIA standards; prepare mitigation plans (avoidance, minimization, offsets) and monitoring protocols tied to performance triggers. You should include adaptive management clauses, third‑party audits, and clear documentation to expedite approvals and limit regulatory fines or forced curtailments.
Step 3: Financial Planning and Funding
You should build a financial model tying capex, opex, and revenue to realistic timelines and incentives. For onshore wind expect roughly $1.0-1.6M per MW and for offshore $3-5M per MW; a 50 MW project therefore needs about $50-80M upfront. Factor construction (12-18 months), grid connection fees, and a 20-25 year PPA while stress‑testing capacity factor swings of ±5 percentage points to see impacts on debt service and LCOE.
Cost Analysis
You should break costs into development, turbines and balance‑of‑plant, civil works, grid connection, and O&M. Turbines commonly account for 60-70% of equipment spend, O&M is often $20-40k per MW‑year, and grid connection can be 5-15% of capex depending on distance. Add contingencies of 5-10% and a decommissioning reserve, then run sensitivity tests on capex ±10% and capacity factor ±5 points to quantify financial risk.
Identifying Financing Options
You can pursue senior bank debt, green bonds, tax‑equity structures, or long‑term corporate PPAs; debt typically covers 60-75% of capex. Development finance institutions such as IFC or EBRD offer concessional loans and partial risk guarantees that lower borrowing costs. Expect lenders to require a DSCR of ~1.3-1.5 and match financing tenor to asset life to avoid refinance risk.
You should structure financing with 60-75% leverage and equity delivering the balance, targeting lender covenants tied to availability and curtailment. Blended finance-combining green bonds or commercial bank loans with DFI guarantees-can reduce interest rates by several hundred basis points. Corporate PPAs of 10-20 years (as used by major tech buyers) create bankable revenue streams, while incentives like the U.S. ITC/PTC under recent legislation can materially improve equity returns and project bankability.
Step 4: Technology and Equipment Selection
You balance turbine size, control systems, and balance-of-plant costs to hit your LCOE targets: onshore turbines typically range 2-5 MW with 25-45% capacity factors, while offshore machines are 8-14 MW with 40-60% CF and hub heights of 100-150 m; evaluate suppliers’ O&M records and financing readiness and consult analyses like the World Bank’s 6 steps to scaling up renewable-energy investments when sizing your capital plan.
Turbine Selection
You match turbine rotor diameter, rated power, and control features to your site’s wind shear and turbulence intensity: class II onshore sites often use 2.5-3.6 MW units with 100-120 m rotors, while offshore projects deploy 10-14 MW turbines with 200-240 m rotors; choose between gearbox and direct-drive based on maintenance access, and require availability guarantees, multi-year service contracts, and spare-part logistics in contracts.
Infrastructure Requirements
You plan grid evacuation, ports, roads, and heavy-lift access early: expect onshore export at 33-220 kV and offshore export at 132-400 kV, site roads 5-8 m wide for blade trailers, and cranes sized from 150 t (smaller onshore) to 1,000+ t offshore depending on nacelle mass and hub height.
For more detail, you must budget for transmission reinforcement and specialized logistics: projects over ~100 km offshore often use HVDC with converter stations that can run into the hundreds of millions, export cable strings typically handle 200-900 MW each, nacelles can weigh 200-500 tonnes and blades reach 80-115 m requiring outsize transport and port staging; coordinate early with your TSO, ports, and heavy-lift contractors to avoid schedule and cost overruns.
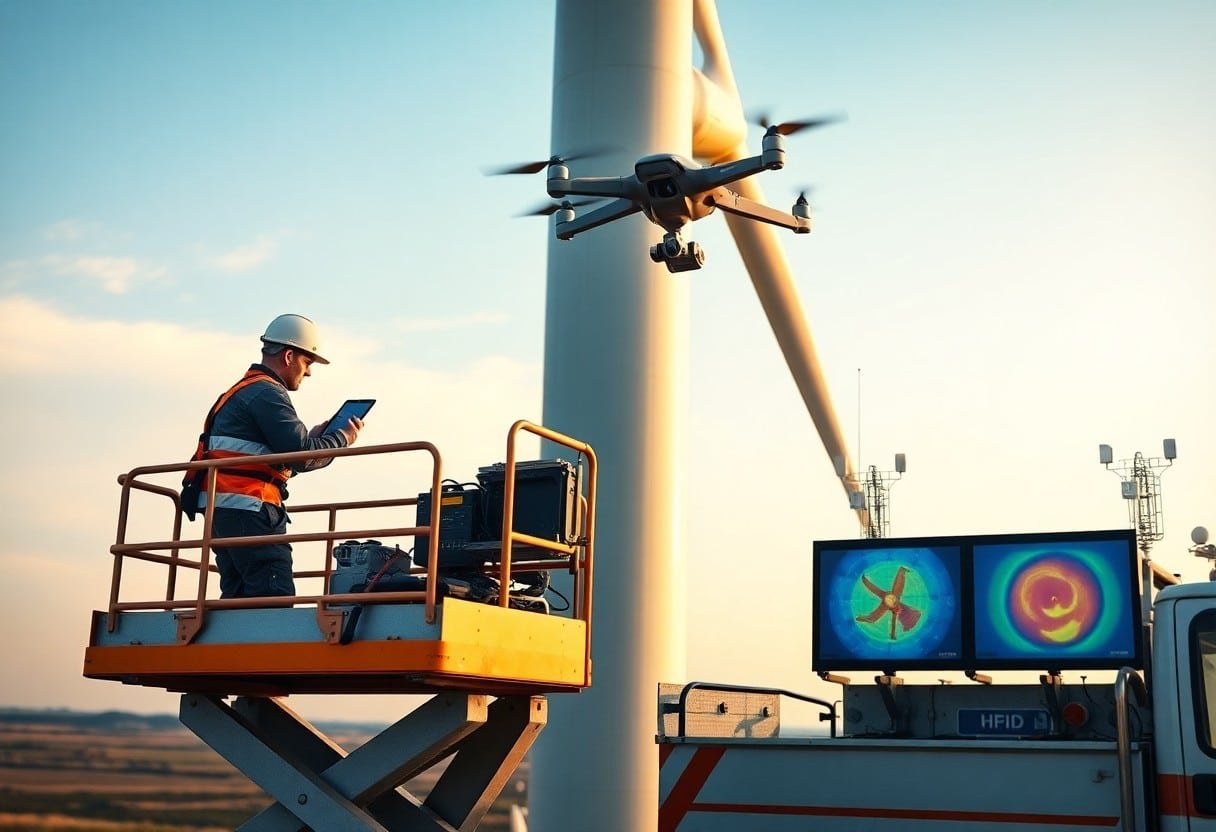
Step 5: Monitoring and Maintenance Strategies
You must deploy layered monitoring and proactive maintenance to keep turbines at target availability (>97% is typical for competitive projects). Implement SCADA plus edge sensors for vibration, pitch, yaw and temperature, and use predictive analytics to flag anomalies before failures. Schedule visual blade inspections annually, gearbox oil analysis quarterly, and adjust intervals based on failure-rate trends. For cross-technology planning, consult resources like 10 Essential Elements of a Sustainable Solar Infrastructure ….
Performance Monitoring
You should monitor KPIs such as capacity factor, availability, power curve deviation, and alarm rates in real time. Use 1 Hz or faster telemetry for critical signals (rotor speed, generator torque) and 10-60 s aggregation for SCADA overview. Employ automated power-curve regression and ML anomaly detection to detect soiling, curtailment, or component degradation; operators who pair SCADA with condition monitoring often reduce unscheduled downtime by substantial margins.
Maintenance Best Practices
You need a mixed strategy: preventive maintenance routines every 6-12 months, annual blade and foundation inspections, and quarterly lubricant and gearbox oil analysis. Prioritize corrective work orders by risk and cost, keep critical spare lists for nacelle, gearbox and generator spares, and contract rapid-response crews to meet onshore MTTR targets under 48 hours where feasible.
For deeper implementation, create an O&M playbook listing top 10 failure modes with mean time between failures (MTBF) and spare coverage, run reliability-centered maintenance reviews annually, and use drone thermography and borescope inspections to reduce rope-access frequency. Track spare-part turnover and logistics KPIs so you maintain 90-95% parts availability for high-risk components and negotiate service-level agreements that align technician response times with your revenue loss per downtime hour.
Conclusion
Hence you can accelerate green energy infrastructure by following the five vital steps for wind projects: assess resources, engage stakeholders, secure financing, deploy resilient technology, and monitor performance; with clear planning and regulatory alignment you will reduce risks, optimize energy yield, and scale sustainable impact while ensuring community benefits and long-term operational success.