Over the next decade you will witness accelerating innovation in wind power as larger turbines, floating offshore platforms, and advanced grid integration lower costs and expand deployment; this outlook explains how policy shifts, investment patterns, and technological advances affect your operations, project development, and opportunities for community-scale generation, helping you assess risks, prioritize investments, and align strategy with decarbonization targets.
Key Takeaways:
- Global wind capacity is accelerating-offshore (including floating) and onshore repowering drive large-scale growth and falling levelized costs.
- Technology advances-larger turbines, digital controls, and hybridization with storage-boost capacity factors and reduce operational costs.
- Policy and market shifts-strong corporate procurement, auction frameworks, and increased financing-spur investment, while grid integration and transmission upgrades remain key constraints.
Current State of the Wind Industry
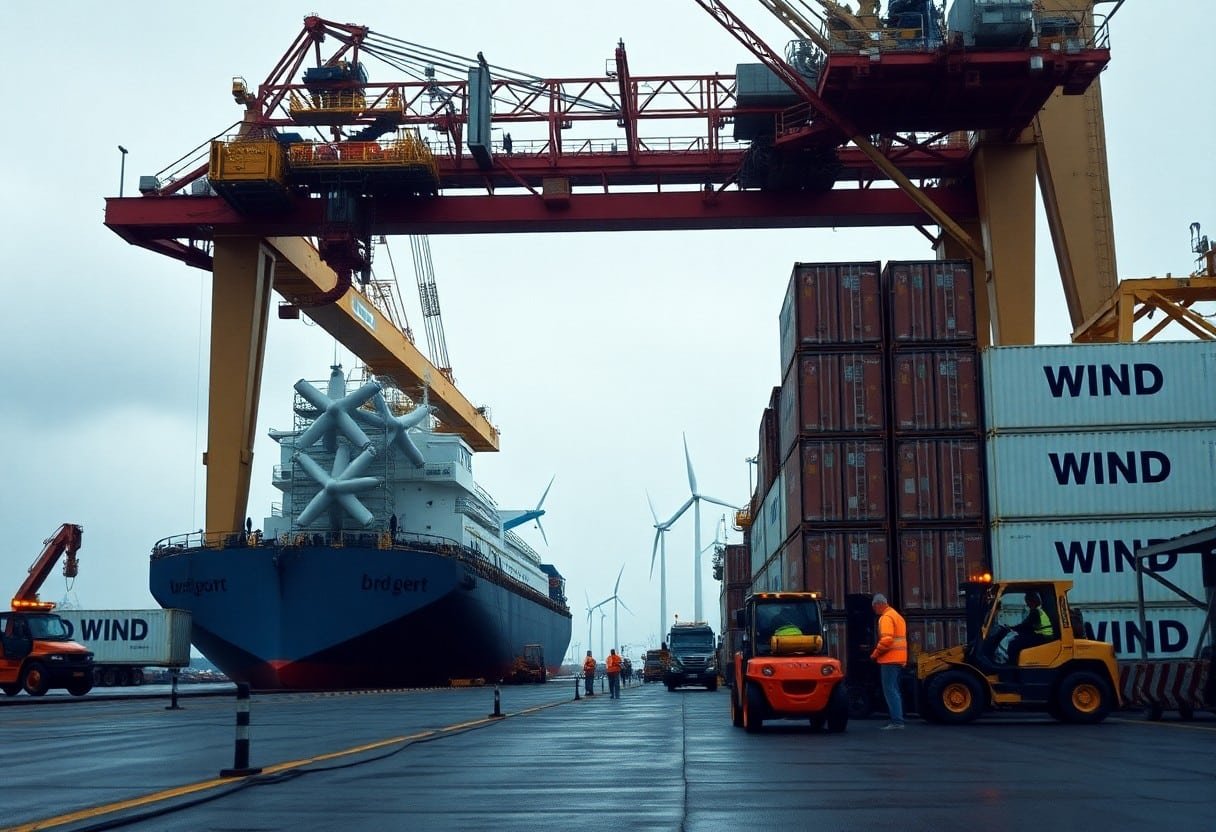
You’re seeing an industry that has moved from niche to mainstream: global installed wind capacity now exceeds 900 GW, with offshore nearing 70 GW and annual additions in the tens of gigawatts. Supply-chain pressures and permitting delays have slowed some markets, but repowering, hybrid projects with storage, and policy-driven auctions keep deployment robust. Project finance remains available where offtake and grid access are clear, so your development choices determine whether you capture current investor appetite.
Global Capacity and Market Growth
You can point to China and the US as the largest capacity holders and installers, followed by Germany, India, and Spain. Emerging markets in Southeast Asia, Brazil, and parts of Africa are showing increased procurement. Annual global installations have ranged broadly but continue in the multiple-tens of GW per year, driven by falling LCOE, policy targets, and corporate Power Purchase Agreements that underpin long-term offtake for your projects.
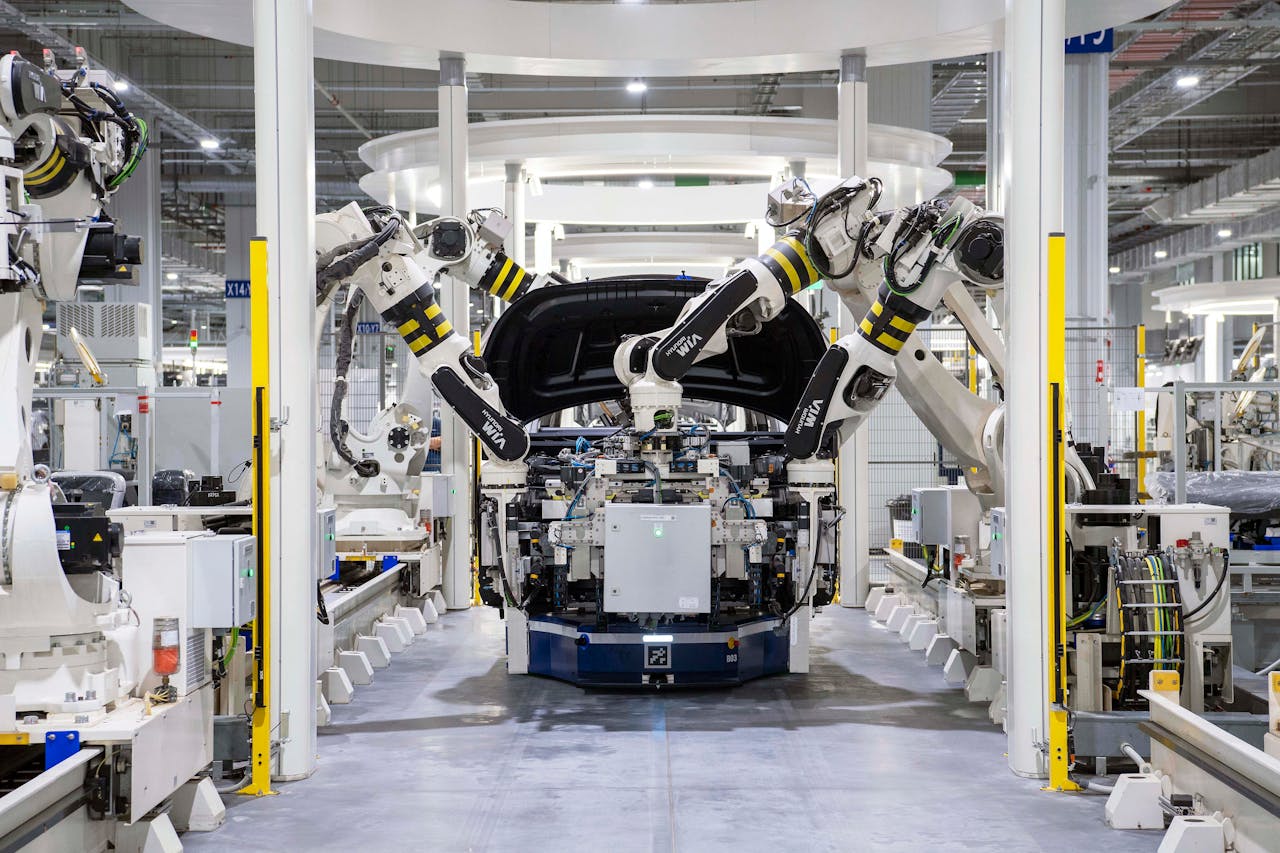
Key Players and Innovations
You’ll notice incumbent OEMs-Vestas, Siemens Gamesa, GE Renewable Energy, Goldwind, Mingyang-competing with newer entrants on turbine size, digital O&M, and integrated project delivery. Examples that matter include Hornsea One’s 1.2 GW scale, Vineyard Wind’s early US offshore contracts, floating demonstrations like Equinor’s Hywind, and 12-15+ MW class turbines that shift your project economics on large offshore sites.
You should track how product roadmaps affect tender outcomes: Vestas’ V236-15.0 MW and GE’s Haliade-derived 12-14 MW platforms raise per-unit energy capture, while Siemens Gamesa’s 14+ MW direct-drive designs target reduced maintenance. In China, Goldwind, Mingyang, and Envision push localized manufacturing and rapid deployment cadence, lowering costs in Asian markets. Floating foundations from Equinor and concept pilots in Japan and Portugal expand viable sites, and digital twins plus predictive maintenance platforms are cutting downtime and optimizing yield-you can leverage these to reduce O&M cost and improve bankability on your next project.
Emerging Technologies in Wind Power
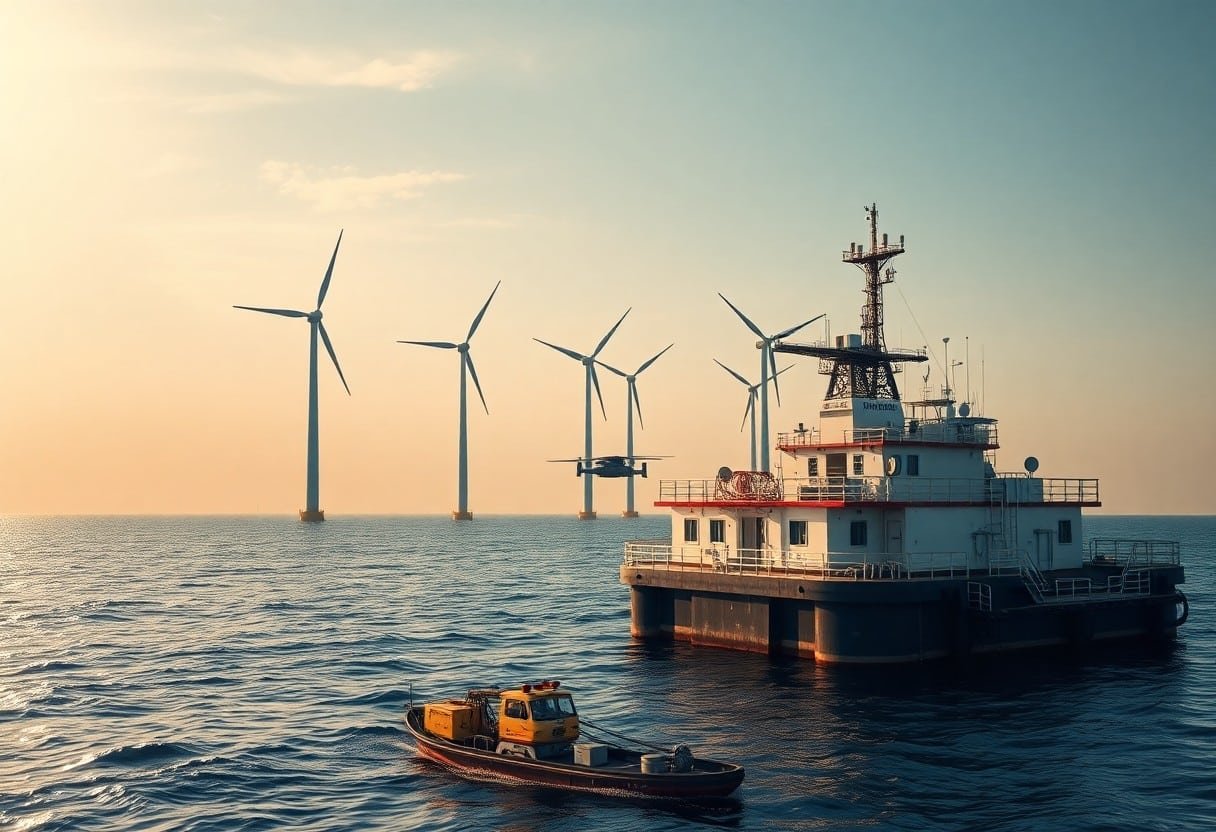
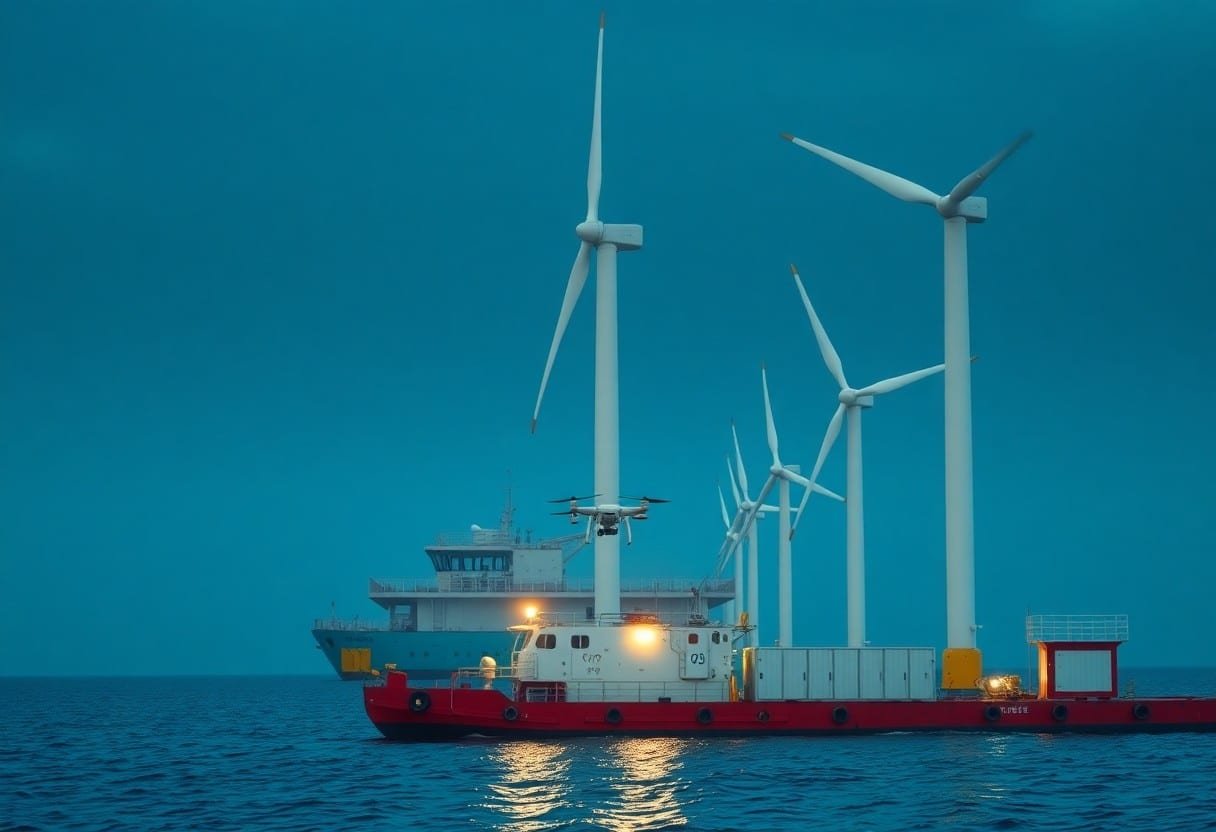
You’re seeing rapid adoption of larger rotors, digital controls, floating platforms and storage co‑location; for example GE’s Haliade‑X and Siemens Gamesa SG 14‑222 push 14 MW class turbines with rotors over 200 m, while Hornsdale’s 150 MW/194 MWh battery shows how storage firms output for grid services and improves commercial value for your projects.
Advances in Turbine Design
Manufacturers lengthen blades past 100 m and use carbon‑fiber spar caps, segmented manufacturing and direct‑drive generators so you get lower mass and fewer gearbox failures; coupled with lidar feedforward control and AI‑driven pitch algorithms, offshore units report capacity factors of 45-50%, and floating platforms like Equinor’s Hywind and the 50 MW Kincardine project let you access deeper, higher‑wind sites.
Integration of Energy Storage Solutions
Batteries, pumped hydro and electrolyzers are now co‑located with wind to time‑shift generation and provide fast frequency response; lithium‑ion systems (Hornsdale 150 MW/194 MWh) and vanadium flow pilots are common, while battery pack prices dropping below $150/kWh by 2023 made 2-4 hour storage increasingly cost‑effective for capacity firming and market participation that boosts your revenue streams.
System integration is moving beyond simple pairing: hybrid inverters, advanced energy management systems and market‑stacking software let you size storage (commonly 1-4 hours) to optimize arbitrage, ancillary services and hydrogen production; electrolyzers scaling from small pilots to multi‑MW plants allow you to convert surplus wind into green hydrogen for industry, transport or seasonal storage, with controls that combine weather forecasts and price signals to maximize project returns.
Policy and Regulatory Trends
Government Incentives and Support
You can tap incentive packages that materially change project economics: the U.S. Inflation Reduction Act directs roughly $369 billion toward clean-energy tax credits, expanding both investment and production credits with domestic‑content and wage bonuses, while auctions, feed‑in premiums and Contracts‑for‑Difference across Europe and Asia drive price discovery and local supply‑chain growth-outcomes that lower your LCOE and improve bankability for new wind projects.
International Agreements and Collaborations
Paris Agreement commitments and regional frameworks like the EU Green Deal and North Seas Energy Cooperation raise national renewables targets and foster cross‑border planning; interconnectors such as Viking Link (≈1.4 GW) let you access broader markets, share balancing capacity, and deploy larger offshore clusters with more predictable offtake.
Harmonization of grid codes, joint procurement and pooled auctions are already reducing administrative friction and financing spreads for developers like you; multilateral support-from IRENA technical assistance to Green Climate Fund financing-also helps your projects in emerging markets meet regulatory standards and attract concessional capital.
Environmental Impact and Sustainability
You’ll see wind’s low lifecycle emissions drive sustainability gains: onshore turbines average ~11 gCO2e/kWh over their life versus ~490 gCO2e/kWh for natural gas, cutting your system-level emissions dramatically. Supply-chain improvements, higher recycling rates for blades and repowering older sites extend asset life and reduce embodied carbon. For strategic projections and policy context, consult the 2026 Renewable Energy Industry Outlook.
Carbon Footprint Reduction
You can quantify impact with project examples: a 3 MW turbine operating at a 35% capacity factor yields ≈9,200 MWh/year, displacing fossil generation and avoiding roughly 4,500 metric tons CO2 annually compared with natural gas. Stacking wind with storage and demand response further reduces marginal emissions during low-wind periods, and life-cycle improvements continue to push embodied emissions downward.
Wildlife Conservation Efforts
You’ll face collision and habitat risks that operators are mitigating with targeted measures: curtailment regimes, radar and acoustic detection, and design changes like blade painting. Field studies report smart curtailment can cut bat mortality by 30-60% while typically costing under 5% loss of annual energy production, making mitigation both effective and practical for your projects.
You should integrate monitoring, micro-siting and adaptive management from project conception: use pre-construction surveys, seasonal construction windows and automated shutdown thresholds (commonly between ~5.5-6.5 m/s) to protect migrating species. Offshore projects add pile-driving timing, bubble curtains and foundation designs that create reef-like habitats benefiting fisheries. Implementing post-construction monitoring and iterative mitigation-partnering with wildlife agencies and using telemetry or radar-lets you refine measures and demonstrate measurable reductions in local impacts.
Economic Considerations
Costs have fallen and system value has risen; you should factor in LCOE declines of 30-50% for onshore wind in many markets since 2010 and rising capacity factors from 10-14+ MW turbines offshore. You can explore technology drivers in 3 Essential Innovations Shaping the Future of Wind Energy that cut O&M and boost output. For developers, tariffs, grid access and local content rules now shape project economics as much as turbine price.
Job Creation and Economic Growth
When you plan projects, note wind supports over 1.2 million jobs globally across manufacturing, installation and O&M; you’ll see construction for a 200 MW wind farm create several hundred temporary roles while operations sustain roughly 10-20 long-term jobs per 100 MW. Examples from Spain and Denmark show local supply chains can multiply regional GDP by 1.5-2x during build phases, and targeted training programs cut lag time to productive employment.
Investment Trends and Financial Viability
Institutional capital is moving in; you should expect onshore capex near $1-1.5M/MW and offshore $2.5-4M/MW, with typical project IRRs of 6-9% in stable markets. Power purchase agreements and merchant exposure materially change returns: in low-risk Europe, PPAs underpin financing, while in emerging markets blended finance, guarantees or concessional debt are used to reach bankable metrics.
You’ll see financing diversify: green bonds, yieldcos and tax-equity drive more builds, while policy shifts like the US Inflation Reduction Act have unlocked significant tax-credit-driven capital. Repowering older sites often raises NPV by 15-30% via higher output and lower O&M, and hybrids (wind+storage) enable revenue stacking through capacity markets, ancillary services and time-shifted dispatch that improve bankability in merchant environments.
Future Outlook and Challenges
Policy shifts and rapid technology adoption will shape your next moves; the DOE’s Wind Market Reports: 2024 Edition highlights near-term capacity, cost trajectories, and regional deployment. You’ll face trade-offs between speed and site complexity as auction prices compress, supply chains tighten, and grid upgrades dictate which projects can actually reach commercial operation on schedule.
Market Forecast and Trends
Expect larger turbines (14-15 MW) and offshore capacity factors above 50% to push energy yields higher, while onshore scale and distributed wind expand in China, the U.S., Brazil, and Vietnam. You should price bids against tightening LCOE expectations and faster commissioning windows, using PPA structures and merchant risk strategies to capture tightening markets and shifting regional demand.
Addressing Technological and Logistical Hurdles
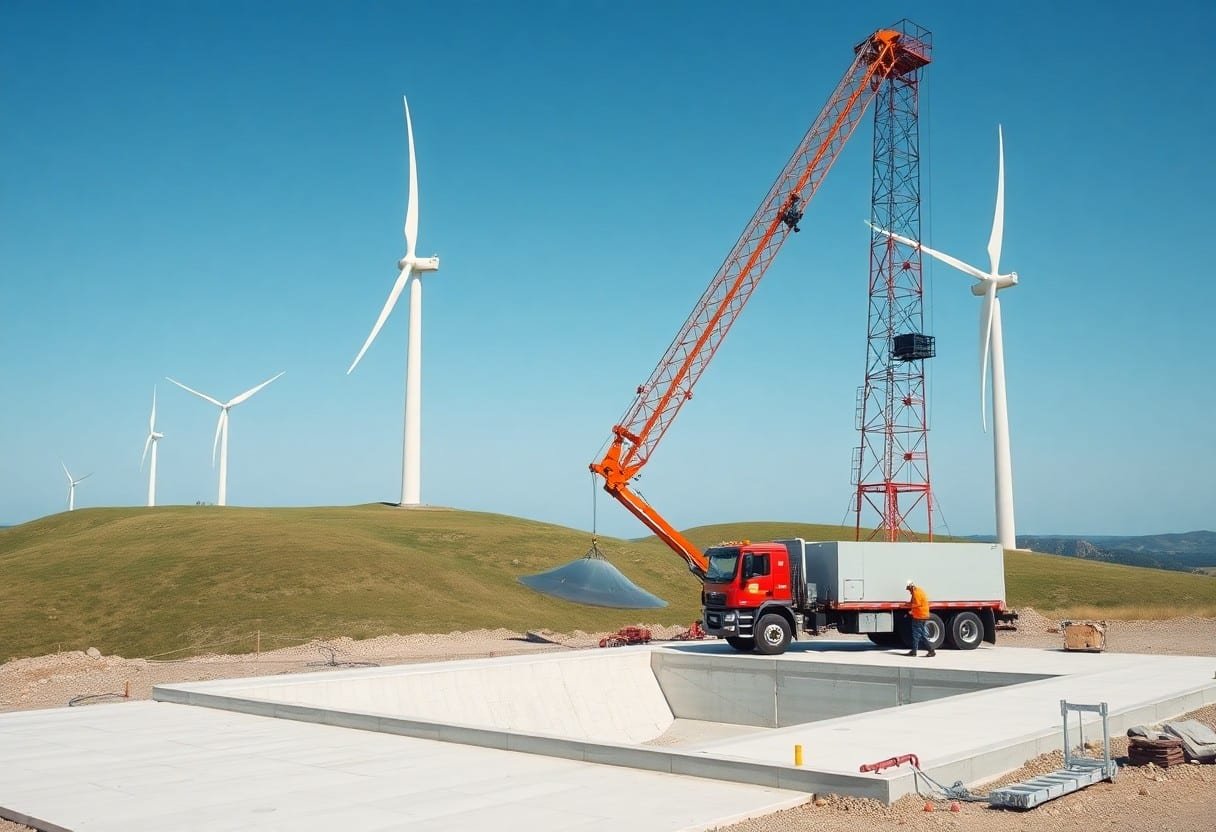
You must confront interconnection backlogs-U.S. queues exceed 1,000 GW-plus port constraints, limited installation vessels, and long component lead times. Suppliers are moving to modular blades and staged logistics to shorten deliveries, and you should integrate digital-twin and predictive-maintenance tools to boost availability and reduce unplanned downtime during early operations.
Apply proven mitigations like pre-funded grid studies, port upgrades (as implemented for Dogger Bank’s Teesside works), and standardized turbine platforms to cut bespoke engineering delays. Developers using local sourcing, staged manufacturing, and on-site battery co-location have trimmed commissioning slippage by months in pilot projects, and you’ll gain the most by combining these with advanced analytics to optimize O&M and supply-chain visibility.
To wrap up
Presently you face accelerating change in wind power: offshore expansion, turbine scaling, hybridization with storage, digital optimization, and policy-driven markets. To secure your role in decarbonization you should align investments, strengthen supply chains, adopt smart operations, and engage regulators. These trends will shape cost trajectories, grid integration, and project viability, so your strategic decisions now determine long-term competitiveness.