Power drives the rapid deployment of wind technologies, reshaping markets, grid design and policy so you can understand how decarbonization becomes practical and scalable; wind lowers costs, diversifies supply, and accelerates electrification while prompting investments in storage, transmission and workforce skills to secure your energy resilience and meet climate targets globally.
Key Takeaways:
- Cost declines and technology advances (larger turbines, offshore floating platforms) make wind one of the fastest-growing low‑carbon power sources and a major driver of decarbonization.
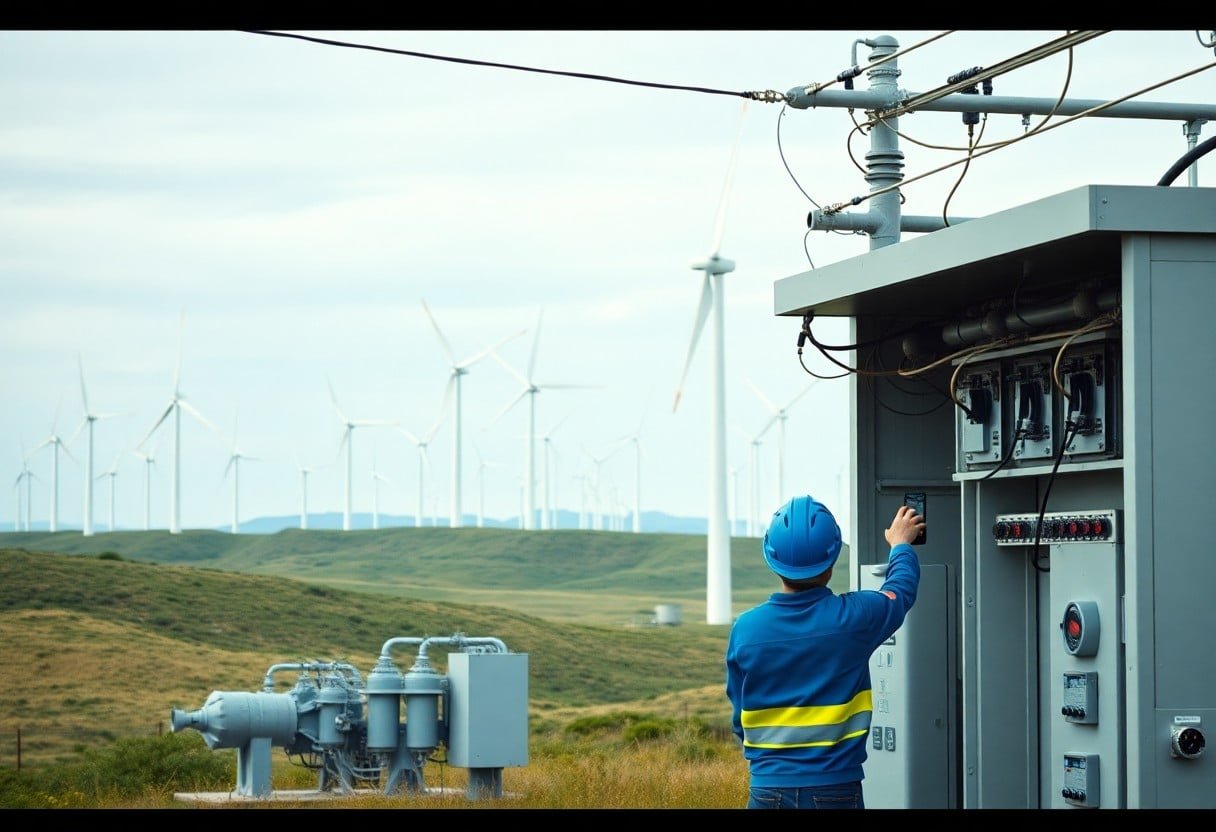
- High wind penetration requires grid upgrades, energy storage, stronger interconnection, and sector coupling (electrification of transport and industry) to maintain reliability and flexibility.
- Policy direction, supply‑chain scaling, and targeted investment shape deployment pace and socioeconomic outcomes-local manufacturing, streamlined permitting, and workforce development amplify benefits.
The Rise of Wind Power
Historical Context
Since large-scale deployment began in the 1990s, you’ve seen wind move from sub-1.5 MW turbines to multi-megawatt machines; Denmark’s Vindeby pilot and California’s 1980s farms marked early proofs. Policy drivers like Germany’s EEG and the US Production Tax Credit accelerated investment, while China’s manufacturing scale-up cut costs by over 70% between 2009 and 2019, making wind increasingly competitive with conventional generation.
Current Global Capacity
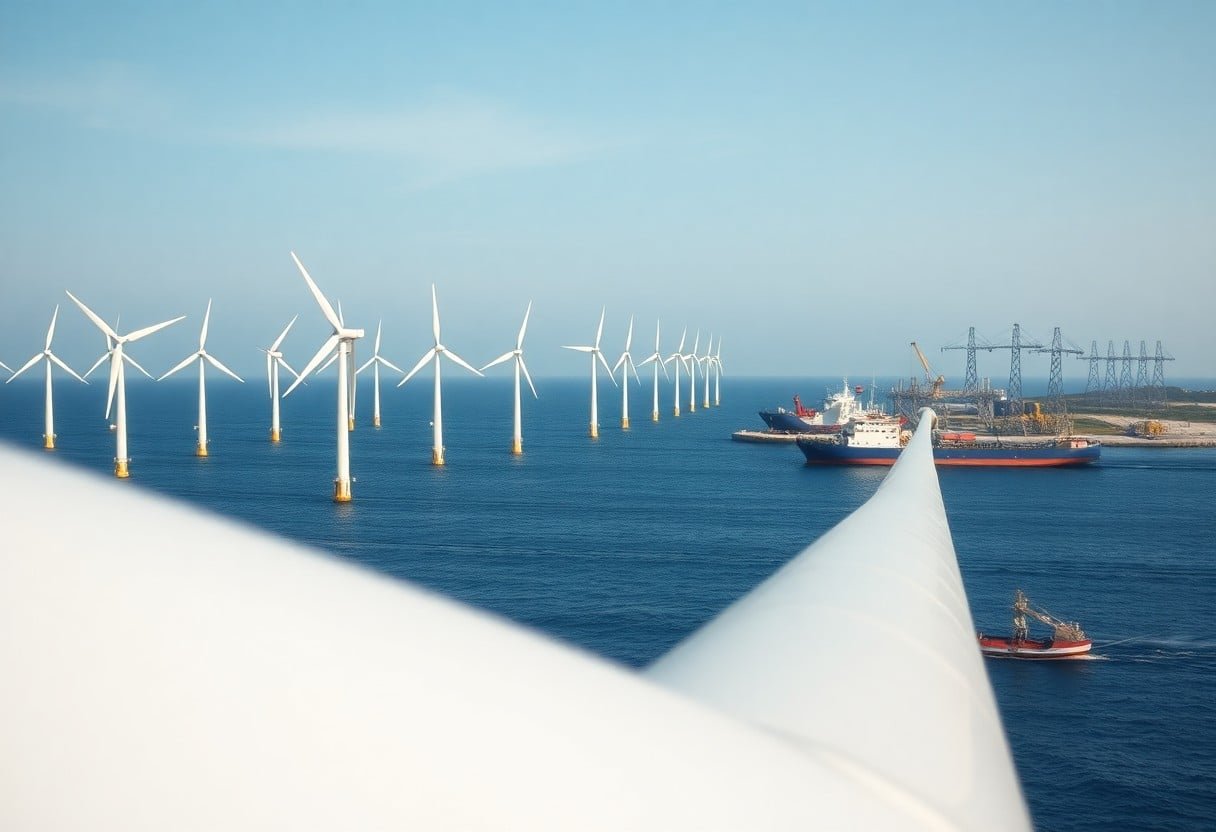
Today you’re observing roughly 900 GW of installed wind capacity worldwide, with offshore surpassing 70 GW; China contributes about 350 GW, the US roughly 140 GW, and the EU near 230 GW. Falling levelized costs and targeted grid projects in Spain and the UK have allowed wind to supply large shares of electricity during high-wind periods, sometimes reaching 30-40% of national generation.
In 2023 you likely noticed record annual additions of roughly 60-80 GW, driven by China and major offshore schemes like Dogger Bank and China’s eastern arrays. Turbines up to 14-15 MW and larger rotors are boosting capacity factors, while repowering campaigns in Germany and Denmark increase output without new sites; persistent grid constraints and growing storage deployment continue to shape where your new projects get built.
Technological Innovations in Wind Energy
You see rapid improvements in blade design, controls, and system integration that push capacity and lower costs: rotor diameters now exceed 200 m, blades use carbon-fiber spars to cut weight, and digital twins from GE and Siemens Gamesa optimize performance in real time. Manufacturers combine larger rotors with direct-drive generators and LiDAR-based yaw control to boost annual energy production; projects like Dogger Bank and Hywind showcase how scale and smart operations change project economics and grid impact.
Turbine Advancements
You encounter turbines rated 12-15 MW in commercial builds-Vestas’ V236-15.0 and Siemens Gamesa’s SG 14‑222 are examples-paired with blades over 100 m that dramatically increase swept area. Innovations in direct-drive designs reduce gearbox failures, while on‑board sensors, predictive analytics and remote firmware updates improve availability. As a result, unit-level capacity rises and downtime falls, so your fleet yields more megawatt-hours per installed megawatt.
Offshore Wind Developments
You can point to Dogger Bank (3.6 GW under construction using GE Haliade‑X 13 MW turbines) and Equinor’s Hywind Scotland (30 MW floating pilot) as proof that fixed-bottom and floating concepts are scaling. Turbines above 12 MW plus purpose-built installation vessels and larger substations let projects reach higher capacity factors-often over 50% offshore-while clustered farms drive supply-chain specialization and cost reductions per MWh.
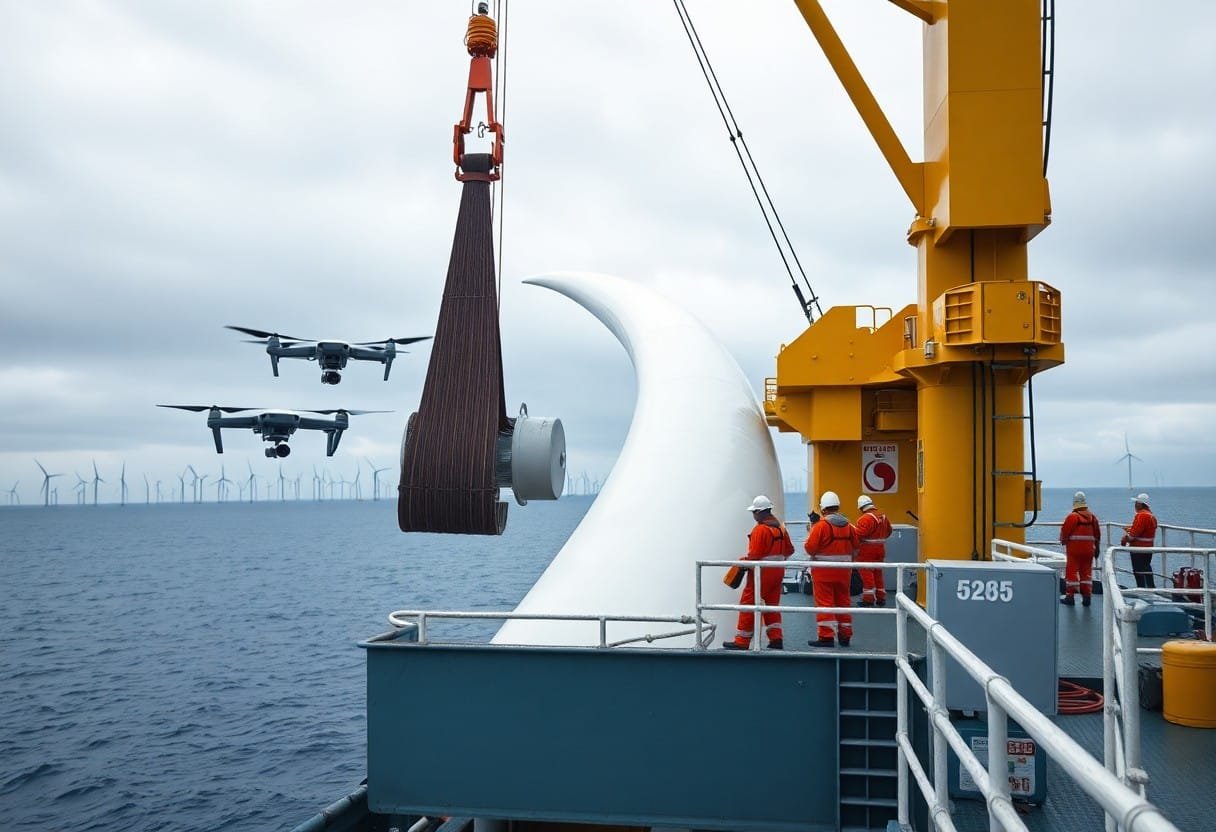
You should note installation and grid integration innovations: monopiles and jacket foundations still dominate shallow sites, whereas semi‑submersible and spar floaters (WindFloat Atlantic, 25 MW) enable development in deeper waters. Specialized WTIVs and service‑operation vessels lift foundations and nacelles, and HVDC export links reduce transmission losses for distant arrays. Those engineering advances shorten construction windows and let you deploy larger arrays farther offshore with lower long‑term O&M exposure.
Wind Power’s Role in Energy Transition
You’ll see wind drive deeper decarbonization by delivering bulk, low‑marginal‑cost energy and by boosting system flexibility; taller turbines and better siting can raise capacity factors 20-40% in many regions, unlocking new resource areas-DOE research documents these advances (2022 Elevated Wind Energy to New Heights), and you benefit from both lower emissions and improved grid resilience as deployment scales.
Environmental Benefits
You cut CO2 and air pollutants by displacing fossil generation-Denmark, for example, routinely exceeds 50% wind on windy days-while wind’s near‑zero water use reduces freshwater demand compared with thermal plants; you can also mitigate wildlife impacts using curtailment, siting adjustments, and radar‑based shutdowns tailored to local species and seasons.
Economic Impact
You capture jobs, investment, and lower wholesale prices as wind expands: Texas now hosts more than 35 GW of wind capacity, attracting supply‑chain plants and pushing down prices during windy hours. You’ll find wind increasingly competitive thanks to substantial cost declines over the last decade, drawing private capital for development, repowering, and grid upgrades.
You should expect tangible local benefits: large projects often create thousands of construction jobs and hundreds of long‑term operations roles, repowering can double output per turbine and extend tax revenue streams, and domestic manufacturing of blades, towers, and nacelles helps anchor regional supply chains and attract multibillion‑dollar investments over project lifetimes.
Policy and Regulatory Framework
You see international commitments and domestic rulebooks convert targets into turbines: over 800 GW of wind capacity installed highlights policy effectiveness, while instruments like auctions, grid codes and permitting windows determine project timelines. For event and advocacy context, read Global Wind Day: How Wind is Powering a Greener Future.
International Agreements
You should factor in how the Paris Agreement and SDG7 steer finance and national pledges, with multilateral funds and regional frameworks enabling cross-border transmission planning and offshore hubs that can integrate tens of gigawatts of wind capacity across shared markets.
National Policies
You will see governments use auctions, feed-in tariffs, tax credits and streamlined permitting to shape markets; the US Inflation Reduction Act and the UK’s Contracts for Difference are clear examples, while China’s auction and grid-priority rules sustain large-scale onshore deployment.
You should examine policy design: auction cadence, strike-price duration (often 10-15 years), grid-connection guarantees and local-content requirements all affect bankability and supply chains; these features helped drive levelized-cost reductions for onshore wind of roughly 40% since 2010, unlocking more private capital for utility and community projects.
Challenges Facing Wind Energy
Supply-chain constraints, grid bottlenecks and permitting delays are squeezing deployment timelines while turbine scale increases-offshore machines now reach 12-14 MW with ~220 m rotors-forcing you to manage logistics, financing and interconnection carefully; policy shifts and market design will determine pace and economics, so review projections in The future of wind energy in 2025: Key trends and ….
Intermittency Issues
Variability forces you to integrate storage, flexible generation or demand response: onshore capacity factors typically run 25-40% and offshore 40-50%, producing hourly swings that stress grids. Projects like Hornsdale (150 MW/193 MWh) show batteries provide fast reserves and market arbitrage, yet seasonal lulls push you toward long‑duration storage, hydrogen or stronger interconnects to ensure reliability.
Land Use and Community Acceptance
You confront siting conflicts over visual impact, wildlife and marine use; onshore wind farms require large lease areas but turbine foundations occupy under 2% of that land, allowing continued farming. Offshore and coastal proposals often trigger local opposition-Vineyard Wind faced permitting and legal delays-so you must prioritize early engagement and clear benefit packages to secure consent.
Community ownership and revenue-sharing materially boost acceptance: Denmark’s cooperative model and Germany’s Bürgerenergie movement accelerated deployment by aligning local interests. You should offer local equity, fund infrastructure or tax payments, provide transparent visualizations and commit to wildlife monitoring; binding community agreements and mitigation plans reduce litigation and shorten permitting timelines.
Future Outlook for Wind Energy
Forecasts point to terawatt-scale deployment this decade as offshore and floating technology unlock deeper sites; Dogger Bank (3.6 GW) and Vineyard Wind I (804 MW) show you how projects will scale. Manufacturing scale and supply-chain maturation have driven onshore costs down roughly 50% over the past decade, so your project economics improve while policy targets (EU 2030, expanding US lease zones, China’s capacity plans) expand market certainty for investors.
Market Trends
China still supplies about half of annual global additions, while auctions and corporate PPAs in Europe and the US push larger, bankable deals; you’ll see longer-term 10-20 year offtake contracts and more merchant exposure. Turbine sizes are growing-10-15 MW offshore models and 5-6 MW onshore become common-so your per-project output rises even if site count stabilizes.
Integration with Other Renewable Sources
Hybridizing wind with solar, batteries, and electrolyzers is becoming standard to firm output and capture value from curtailment; you can pair a 200 MW wind farm with a 100-200 MWh battery for 2-4 hour firming or add multi‑MW electrolyzers to produce green hydrogen during low prices. Pilot projects in Europe and Australia already demonstrate lower system costs and higher utilization when you stack services.
Operationally, you’ll optimize hybrid sites by DC‑coupling wind and solar to share inverters and reduce balance‑of‑system costs, cutting capex per MW by up to 15-25% in some studies. Grid-wise, batteries provide frequency response and synthetic inertia while electrolyzers act as flexible loads absorbing excess generation; that lets you bid into ancillary markets and diversify revenue beyond energy sales. Developers in Spain and the UK have already secured higher IRRs by structuring combined asset PPAs and tapping green‑hydrogen offtake agreements.
To wrap up
Considering all points, you will find wind power accelerating the global energy transition by lowering emissions, reducing power costs, and diversifying supply; as turbines scale and storage and grid technologies advance, your energy systems gain resilience and flexibility, governments and markets attract investment, and you can influence outcomes through policy support, deployment choices, and demand-side measures.